The Problem

Most dashboards are built for finance or SaaS, not agriculture, and it shows. Cram twenty charts, tiny fonts, random colours, and generic KPI cards onto a screen and you get clutter with no visual hierarchy: the opposite of what a farmer or agronomist needs. Agricultural data isn't spreadsheet data. Soil moisture, NDVI imagery, pest pressure, irrigation status, and crop health each carry their own visual logic, and forcing them into an admin template built for tracking invoices or sign-ups strips out the meaning they're supposed to convey.

The Solution

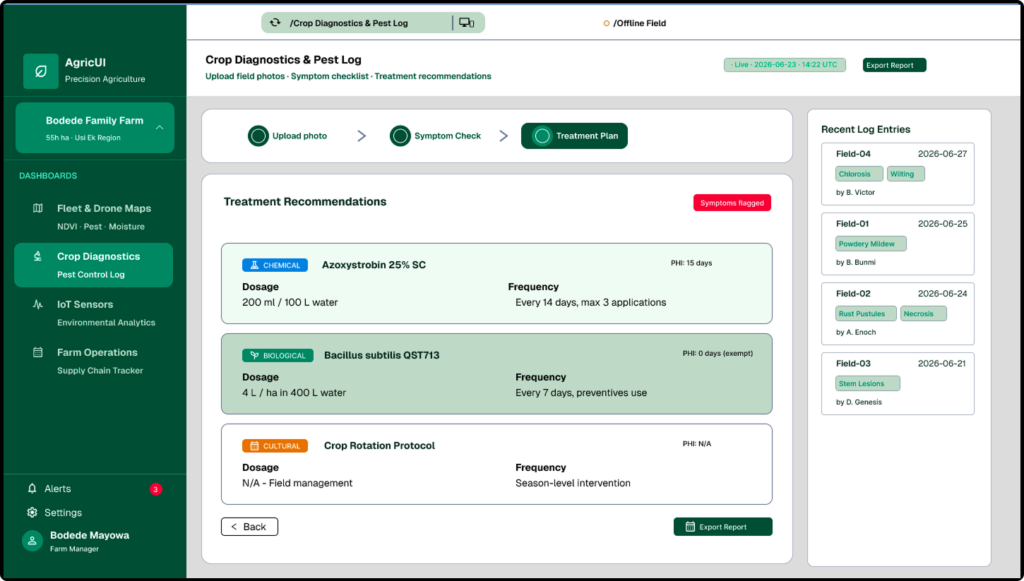
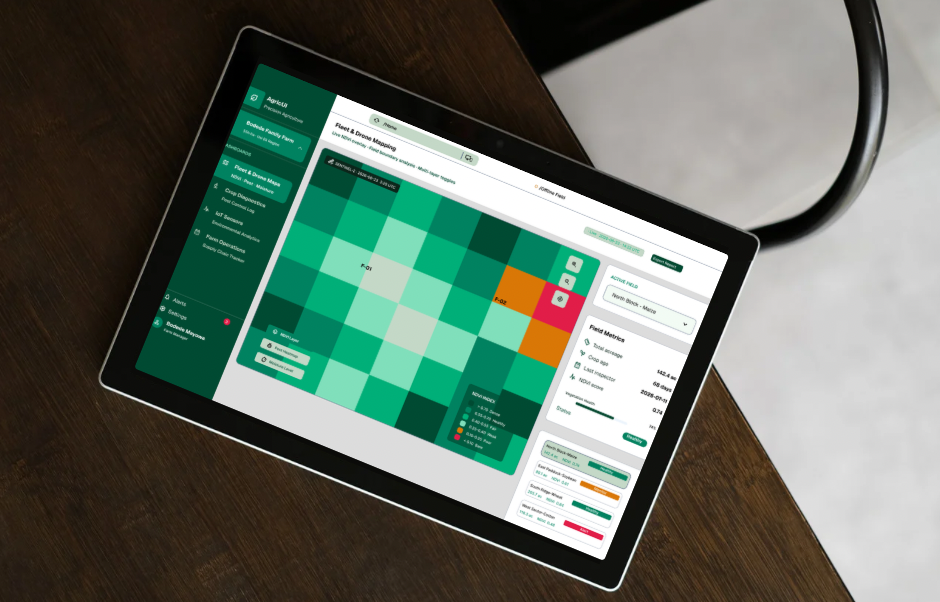
AgriUI was designed the other way around, starting from the workflow instead of the template. Its dashboard brings together a Crop Health card, Soil Moisture widget, weather forecast, pest heatmap, irrigation status, NDVI map, and farm boundary map—each one built specifically for how agricultural data is actually read and acted on. That's because it comes from a UX designer with a background in Crop Protection, someone fluent in both the science and the interface, so AgriUI bridges the gap between complex agricultural data and a digital experience that's actually intuitive to use

Research & Ideation
Three conditions, not three preferences

Before any component got drawn, three field constraints were written down as a non-negotiable spec — the same way an engineer would spec load tolerances, not style preferences.

☀ Sun glare & outdoor contrast — WCAG AAA compliance throughout — #0B251A against #FFFFFF, a 7:1+ contrast ratio. No soft greys anywhere; text needs to be read outdoors. — Every trend line and icon holds a 2.5px+ stroke so nothing washes out in direct sun.

🧤 Physical operator ergonomics — Every button, checkbox, and map control holds a 48×48px minimum touch target, sized for a gloved thumb. — Primary actions live in the bottom third of the screen — the zone a hand can reach one-handed while walking.

📡 Low-connectivity architecture — Binary checklists replace open text fields for field logging, cutting typing to near zero. — A persistent "Syncing Locally" badge stands in for hard error screens when the signal drops.
Four dashboards, one shared component set

Rather than one generic dashboard, AgriUI shipped as four purpose-built screens — each solving a distinct problem a farm operations team actually has, all composed from the same underlying primitives.

🛰 Fleet & drone mapping

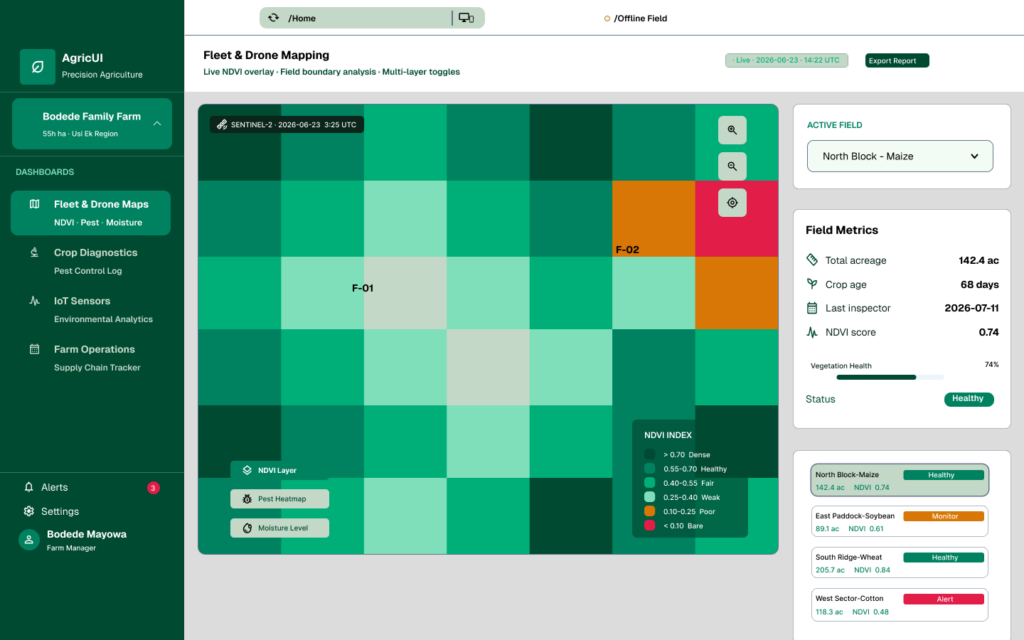
AgTech teams have drone and satellite imagery, but struggle to layer it cleanly with field data. This screen pairs a large NDVI map with floating layer controls and a side panel of the metrics that matter — acreage, crop age, last inspection.

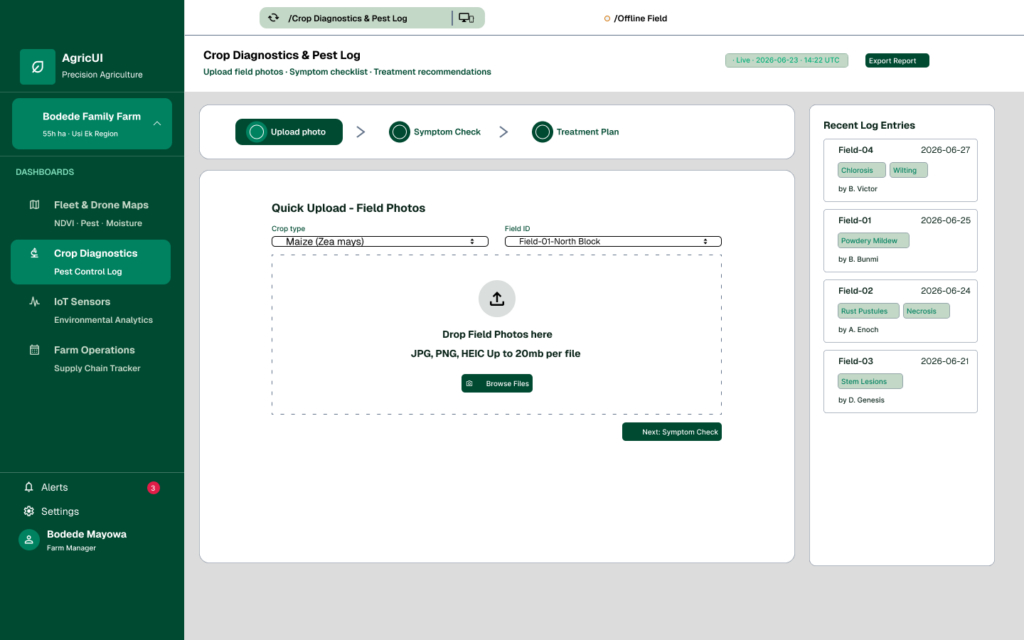
🌿 Crop diagnostics & pest log

Field workers need to log symptoms fast, standing in the row. A quick-upload photo zone, a multi-step symptom checklist, and a treatment card replace what used to be a paper form and a delayed data-entry pass back at the office.

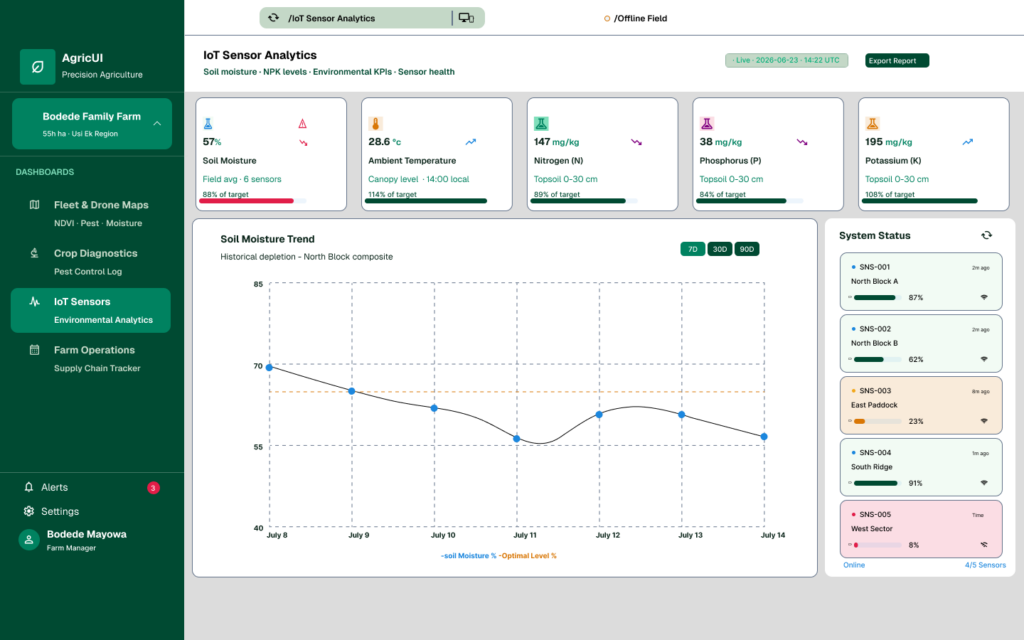
📡 IoT sensor & environmental analytics

Smart farms generate more telemetry than any one person can read. A three-column KPI grid — soil moisture, temperature, NPK — sits above a 7/30/90-day trend line and a system-status card for battery and signal health.

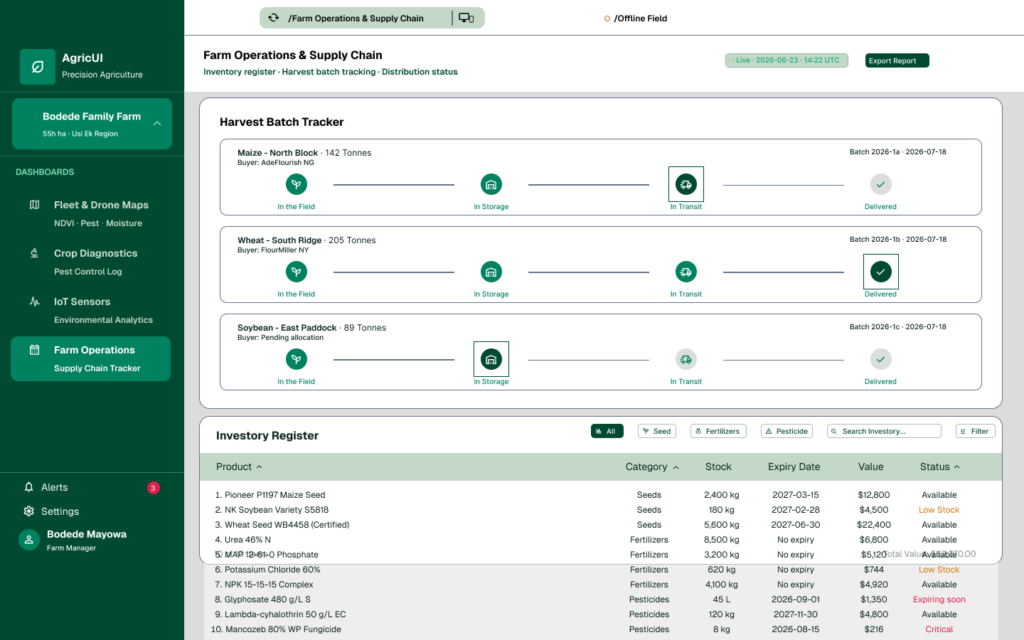
🚚 Farm operations & supply chain

Co-operatives need to see inventory, yields, and distribution in one place. A filterable table covers seed, fertiliser, and pesticide stock, while a horizontal progress tracker follows each batch from field to storage to transit.

The constraints applied to one real screen

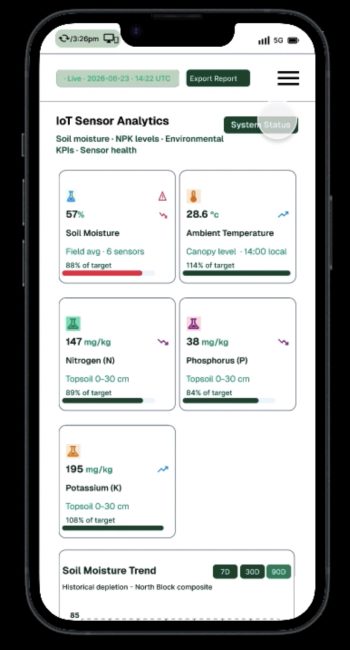
The IoT Sensor Analytics dashboard, reduced to a 390px mobile screen. The header, breadcrumb, offline-field status, and live indicator stay pinned, while the KPI cards and trend chart scroll underneath. It's a pattern built once and reused everywhere a screen has more content than a phone has height.

— Offline-field status is part of the header chrome, not a toast that disappears; operators always know their connectivity state at a glance.
— Splitting the screen into a fixed header and a scrolling body kept orientation context on screen without shrinking the data below it.
— Every card, toggle, and nav icon in this screen still resolves to the same 48×48px minimum touch target from the constraint spec.

IMG_4958
The deliverables

— 60+ Figma components across four production dashboards, all built on the same AAA-contrast token set.
— A reusable sticky-header / scrolling-body mobile pattern, ready to apply to any screen taller than a phone.

Role

Product design, User experience design, and UI system,